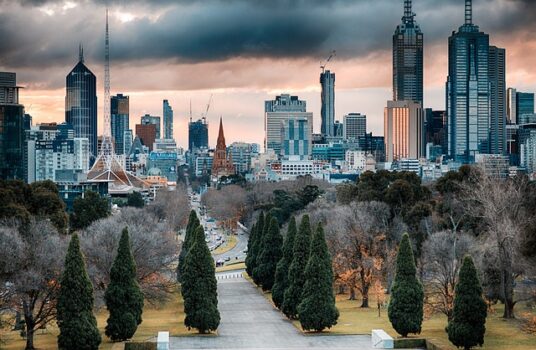
Based on median house prices, Melbourne’s cheapest suburbs included:
- Melton – Located about 35km west of Melbourne CBD
- Kurunjang – Adjacent to Melton
- Melton South – Southern extension of Melton
- Laverton – Western suburb, approximately 17km from CBD
- Werribee – Western suburb, about 32km from CBD
- Wyndham Vale – Southwestern suburb
- Hoppers Crossing – Western suburb near Werribee
- Dallas – Northern suburb, about 18km from CBD
- Meadow Heights – Northern suburb
- Broadmeadows – Northern suburb, approximately 16km from CBD
Historical Appreciation Patterns (2000-2024)
General Trends
- 2000-2007: Steady growth period with annual appreciation rates of 7-10%
- 2008-2009: Slight slowdown during the Global Financial Crisis, but Melbourne avoided significant downturns
- 2010-2013: Recovery period with moderate growth
- 2014-2017: Strong growth phase with some suburbs seeing 15-20% annual increases
- 2018-2020: Market correction and COVID-19 impacts
- 2021-2023: Post-pandemic recovery with renewed growth
- 2023-2024: Stabilization period
Specific Suburb Performance
Western Suburbs (Melton, Werribee cluster)
- Started from very low bases in the early 2000s
- Experienced significant percentage growth due to infrastructure improvements
- Benefited from the “ripple effect” as buyers were priced out of middle-ring suburbs
- Melton showed approximately 250-300% total appreciation from 2000-2024
- Werribee and surrounding areas showed 280-320% total appreciation in the same period
Northern Suburbs (Dallas, Broadmeadows cluster)
- Initially industrial areas with lower appeal
- Urban renewal projects improved livability
- Cultural diversity increased with new immigrant communities
- Showed slightly lower but still substantial growth of 220-260% from 2000-2024
Key Growth Drivers
- Infrastructure Development
- Western suburbs benefited from improved transport connections
- Expansion of suburban train lines
- Road infrastructure improvements (Western Ring Road upgrades)
- Employment Opportunities
- Development of industrial parks and logistics centers near western suburbs
- Growth in retail and service industries
- Affordability Push
- As inner and middle Melbourne became increasingly unaffordable, buyers moved outward
- First-home buyers and investors targeted these areas for entry-level properties
- Government Initiatives
- First-home buyer grants stimulated demand in affordable areas
- Urban renewal programs in northern suburbs
Comparative Performance
While these suburbs showed strong percentage growth due to their low starting bases, in absolute dollar terms the gains were less than Melbourne’s affluent areas. However, they often outperformed middle-market areas in percentage terms, making them attractive for investors seeking growth potential.
Population Growth Trends (2000-2024)
Western Growth Corridor (Melton, Werribee cluster)
- Melton region: Grew from approximately 40,000 residents in 2000 to over 165,000 by 2024 (~312% growth)
- Wyndham area (including Werribee, Hoppers Crossing): Expanded from about 85,000 to over 270,000 residents (~217% growth)
- One of Australia’s fastest-growing municipal areas during this period
Northern Suburbs (Broadmeadows cluster)
- More moderate growth compared to western suburbs
- Hume City Council area: Increased from around 140,000 in 2000 to approximately 240,000 by 2024 (~71% growth)
Key Demographic Shifts
Family Composition
- Western suburbs: Predominantly young families with children
- Higher proportion of households with 3+ children compared to Melbourne average
- Significant first-home buyer presence
- Northern suburbs: More diverse household structures
- Multigenerational households more common
- Mix of established families and new arrivals
Cultural Diversity
- Melton/Werribee areas: Initially predominantly Anglo-Australian, saw increasing diversity with:
- South Asian communities (particularly Indian and Sri Lankan)
- Filipino communities
- African communities (particularly Sudanese and Ethiopian)
- Northern suburbs (Dallas, Broadmeadows, Meadow Heights):
- Historically strong Middle Eastern and Turkish communities
- Growing South Asian population
- Established Mediterranean communities (Italian, Greek)
- More recent African communities
Age Distribution
- Western growth corridor: Significantly younger population
- Median age approximately 32 years (compared to Melbourne’s 37)
- Higher proportion of children under 14
- Lower proportion of seniors (65+)
- Northern cluster: More balanced age distribution
- Higher proportion of established families
- Growing senior population in some areas like Broadmeadows
Socioeconomic Indicators
- Income levels: Generally 70-80% of Melbourne median
- Education: Lower tertiary education rates but increasing
- Employment sectors:
- Manufacturing (declining but still significant)
- Logistics and transport
- Retail and services
- Healthcare and social assistance (growing sector)
How Demographics Influenced Property Values
Housing Stock Evolution
- Initial predominance of 3-4 bedroom single-family homes
- Gradual increase in medium-density developments
- Shift toward smaller lot sizes (400-500m²) compared to traditional quarter-acre blocks
Property Type Demand
- Strong preference for detached houses over apartments
- Growing interest in townhouse developments near transport and amenities
- Emerging premium segments within affordable suburbs (newer estates with better amenities)
Impact on Appreciation Patterns
- Areas with higher population growth (western corridor) generally saw stronger property appreciation
- Suburbs with improving socioeconomic indicators experienced better relative growth
- Cultural diversity contributed to specialized local retail and services, improving suburb appeal
Demographic-Driven Market Segments
First Home Buyer Zones
- Areas like Wyndham Vale and Melton South became first-home buyer hotspots
- Government incentives specifically boosted these markets
- Created entry-level price points rarely found elsewhere in Melbourne
Investor Appeal Zones
- Suburbs with strong rental demand (like Werribee and Hoppers Crossing)
- Higher rental yields compared to Melbourne average (typically 4-5% vs 2-3%)
- Attracted investors priced out of inner and middle-ring suburbs
Migration Settlement Patterns
- New migrant communities often clustered in specific affordable suburbs
- Created community networks and specialized local services
- Established cultural enclaves that attracted further settlement from the same communities
The interplay between population growth, changing demographics, and property markets has been particularly pronounced in these affordable suburbs, creating distinctive market dynamics compared to Melbourne’s more established areas.
