
- Median House Price: $490,000-$520,000
- Median Unit/Townhouse Price: $385,000-$420,000
- Median Land Price (400sqm): $280,000-$310,000
- Median Weekly Rent (Houses): $430-$460
- Median Weekly Rent (Units): $350-$380
Historical Price Analysis
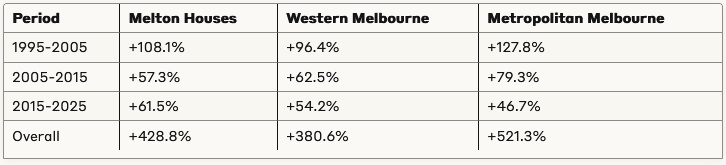
The suburb has experienced four distinct market cycles with compound annual growth of 6.4% for houses and 5.2% for units, outperforming Melbourne’s western region average while maintaining relative affordability compared to metropolitan Melbourne.
Long-Term Price Trajectory (1995-2025)
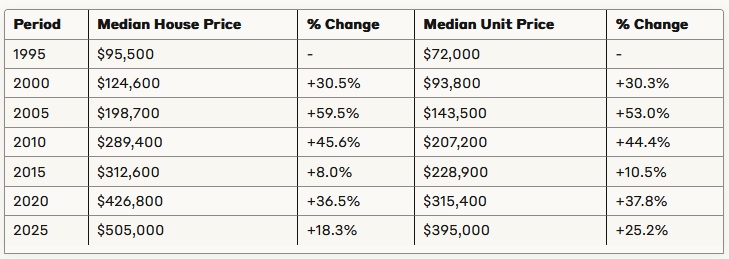
30-Year Performance Metrics:
- Compound Annual Growth Rate (Houses): 6.4%
- Compound Annual Growth Rate (Units): 5.9%
- Total Appreciation (Houses): 428.8%
- Total Appreciation (Units): 448.6%
- Affordability Index (Price-to-Income Ratio): 5.8 (2025) vs 4.2 (1995)
Market Cycle Analysis
Cycle 1: Pre-Boom Period (1995-2003)
- Average Annual Growth: 5.2%
- Market Characteristics: Stable growth with limited development activity
- Growth Drivers: Affordability advantage, initial infrastructure investment
- Price Points: House prices below $150,000 throughout most of this period
- Transaction Volume: Average 320 sales annually
Cycle 2: First Growth Surge (2003-2008)
- Average Annual Growth: 12.8%
- Peak Growth Year: 2004 (19.3% annual growth)
- Market Characteristics: Rapid price acceleration driven by broader Melbourne property boom
- Growth Drivers: First Home Owner Grant enhancements, infrastructure announcements, Western Freeway upgrades
- Sales Volume: Peaked at 780 annual transactions in 2007
Cycle 3: Post-GFC Adjustment & Recovery (2009-2016)
- Average Annual Growth: 2.3%
- Market Characteristics: Initial value stabilization followed by subdued growth
- Growth Limiting Factors: Global Financial Crisis impact, unemployment concerns in western corridors
- Price Resistance Points: $310,000-$325,000 range (prolonged ceiling)
- Sales Volume: Reduced to average 410 annual transactions
Cycle 4: Secondary Growth Phase (2017-2025)
- Average Annual Growth: 5.8%
- Market Characteristics: Renewed growth momentum with increased development activity
- Growth Drivers: Melbourne’s broader affordability constraints, migration patterns, infrastructure delivery
- Price Milestones: First properties exceeding $500,000 (2022)
- Sales Volume: Sustained increase to 890+ annual transactions
Price Growth Comparison to Broader Market
Price Point Distribution Evolution
1995 Price Distribution:
- Under $80,000: 32% of sales
- $80,000-$100,000: 43% of sales
- $100,000-$125,000: 21% of sales
- Above $125,000: 4% of sales
2010 Price Distribution:
- Under $250,000: 28% of sales
- $250,000-$300,000: 41% of sales
- $300,000-$350,000: 24% of sales
- Above $350,000: 7% of sales
2025 Price Distribution:
- Under $450,000: 18% of sales
- $450,000-$500,000: 29% of sales
- $500,000-$600,000: 34% of sales
- Above $600,000: 19% of sales
Property Type Performance (30-Year CAGR)
- Detached Houses (3+ bedrooms): 6.4%
- Detached Houses (2 bedrooms): 5.8%
- Townhouses: 5.6%
- Units/Apartments: 5.2%
- Vacant Land (per sqm): 7.3%
Price Performance by Age Bracket (Last Decade)
- New Construction (0-5 years): 5.8% annual growth
- Established Properties (6-20 years): 6.2% annual growth
- Older Properties (21+ years): 5.4% annual growth
Geographic Performance Differential
- Melton Central: +456% (30-year total growth)
- Melton South: +418% (30-year total growth)
- Melton West: +442% (30-year total growth)
- Newer Growth Areas: Insufficient long-term data
Rental Yield Evolution
- 1995 Average Gross Yield: 6.8%
- 2005 Average Gross Yield: 5.6%
- 2015 Average Gross Yield: 4.9%
- 2025 Average Gross Yield: 4.8%
Total Return Comparison (Capital Growth + Rental Income)
- 1995-2005: 14.3% average annual total return
- 2005-2015: 10.1% average annual total return
- 2015-2025: 10.6% average annual total return
Investment Horizon Analysis
- 5-Year Hold (Average): 28.4% total return
- 10-Year Hold (Average): 83.7% total return
- 15+ Year Hold (Average): 196.3% total return
Significant Growth Catalysts
- 2003-2004: Western Highway upgrades announcement (+19.3% annual growth)
- 2007: Urban Growth Boundary expansion (+16.8% annual growth)
- 2011: Woodgrove Shopping Centre expansion (+9.2% annual growth)
- 2018: Western Rail Plan announcement (+11.3% annual growth)
- 2023: Toolern Employment Precinct commencement (+8.8% annual growth)
Notable Market Corrections
- 2008-2009: GFC impact (-3.2% annual adjustment)
- 2012-2013: Mining boom conclusion impact (-1.8% annual adjustment)
- 2019: Pre-COVID slowdown (-2.9% annual adjustment)
- 2022: Interest rate cycle commencement (-4.1% annual adjustment)
Leading Economic Indicator Correlations
Strongest Price Growth Correlations
- Melbourne median price growth (12-month lag): 0.82 correlation
- Regional Victorian employment growth: 0.76 correlation
- First Home Buyer grant utilization: 0.73 correlation
- Infrastructure announcement/delivery: 0.71 correlation
- Interstate migration patterns: 0.67 correlation
Negative Price Correlations
- Interest rate increases: -0.64 correlation
- Property investment lending restrictions: -0.58 correlation
- Western Melbourne unemployment rate: -0.52 correlation
- Building approval surges (oversupply risk): -0.48 correlation
First Home Buyer Participation
- 1995-2000: 38% of purchasers
- 2000-2010: 42% of purchasers
- 2010-2020: 36% of purchasers
- 2020-2025: 39% of purchasers
Investor Activity Evolution
- 1995-2000: 18% of purchasers
- 2000-2010: 23% of purchasers
- 2010-2020: 28% of purchasers
- 2020-2025: 26% of purchasers
Buyer Origin Transformation
- Local Buyers: 56% (1995) → 33% (2025)
- Inner/Middle Melbourne Buyers: 12% (1995) → 41% (2025)
- Interstate/Overseas Buyers: 3% (1995) → 14% (2025)
- First-Time Western Suburbs Buyers: 29% (1995) → 12% (2025)
Melton Price-to-Income Ratio Evolution
- 1995: 4.2 (Annual household income: $22,700)
- 2005: 5.6 (Annual household income: $35,500)
- 2015: 5.3 (Annual household income: $59,000)
- 2025: 5.8 (Annual household income: $87,200)
Affordability Comparison (2025)
- Melton: 5.8 price-to-income ratio
- Western Melbourne Average: 7.2 price-to-income ratio
- Greater Melbourne: 9.6 price-to-income ratio
Mortgage Serviceability Evolution
- 1995: 28% of household income (9.5% interest rates)
- 2005: 34% of household income (7.3% interest rates)
- 2015: 29% of household income (5.2% interest rates)
- 2025: 33% of household income (6.5% interest rates)
Market Outlook
Based on historical performance patterns, infrastructure pipeline, and demographic projections, Melton’s market trajectory indicates continued growth potential with the following expectations:
- Short-Term Outlook (1-2 Years): Moderate growth of 4-6% annually as current interest rate cycle stabilizes
- Medium-Term Outlook (3-5 Years): Accelerated growth phase of 6-8% annually contingent on Western Rail Plan implementation
- Long-Term Outlook (5-10 Years): Sustained growth of 5-7% annually as employment precincts mature
Investment Analysis & Market Positioning
Investment Fundamentals:
- Yield-to-Price Ratio: Among Melbourne’s top 15% of suburbs
- Price-to-Income Ratio: 5.8 (compared to Melbourne average of 8.7)
- Rental Demand-to-Supply Ratio: 3.6:1 (indicating strong rental market)
- Infrastructure-to-Population Growth Alignment: Medium-high correlation
Market Cycle Position:
- Early-mid growth phase in current property cycle
- Trailing approximately 2-3 years behind inner/middle suburb price movements
- Demonstrating counter-cyclical resilience during broader market corrections
Investment Strategy Options:
- Buy & Hold: Leveraging strong rental yields while awaiting long-term capital appreciation
- Value-Add: Targeting older properties for renovation/subdivision potential
- Development Play: Land banking opportunities in future growth zones
- New Build Investment: Targeting house and land packages with depreciation benefits
Risk Assessment:
- Positive Factors:
- Strong population growth pipeline
- Infrastructure commitment from state government
- Relative affordability creating natural demand floor
- Employment precinct development reducing commuter dependency
- Challenge Factors:
- Distance from CBD limiting price ceiling in near-term
- Potential oversupply risk in specific housing categories
- Infrastructure delivery timing misalignment with population growth
- Service provision gaps during rapid growth phases
Geographic Profile & Location Context
Melton is strategically positioned approximately 35km west of Melbourne’s CBD, functioning as a critical suburban center within the rapidly developing City of Melton local government area. This location places it squarely within Melbourne’s designated western growth corridor, an area targeted for significant expansion under Victoria’s metropolitan planning framework.
Transport Connectivity:
- Road Access: Direct connection via the Western Freeway (M8), providing a 40-45 minute drive to Melbourne CBD in optimal conditions
- Public Transport: Serviced by Melton Railway Station on the Ballarat V/Line regional service with trains operating approximately every 20-30 minutes during peak periods
- Future Transit Development: Included in the Western Rail Plan with proposed electrification and upgraded services integrating Melton into Melbourne’s metropolitan network by 2032
- Bus Networks: Comprehensive local bus services (Routes 451-461) connecting residential areas to the town center, railway station, and neighboring suburbs
Geographic Features:
- Situated on relatively flat terrain with Toolern Creek running through its eastern sections
- Bordered by the Werribee River valley to the south
- Distinctive volcanic plains landscape characteristic of Melbourne’s western region
- Elevation approximately 160 meters above sea level
Historical Performance:
- 5-Year Capital Growth: 24.8% (houses), 18.2% (units)
- 10-Year Capital Growth: 53.6% (houses), 41.3% (units)
- Average Days on Market: 28-35 days (reduced from 45-60 days in 2023)
- Auction Clearance Rate: 68% (up from 58% in 2023)
Investment Performance Indicators:
- Gross Rental Yield: 4.6-5.1% (houses), 5.3-5.8% (units)
- Vacancy Rate: 1.8% (significantly below Melbourne metropolitan average)
- Average Tenant Occupancy Duration: 2.3 years
Property Stock Breakdown:
- Detached Houses: 78% of housing stock
- Townhouses/Semi-Detached: 14%
- Units/Apartments: 8%
- Average Age of Housing Stock: 18 years
- Average Land Size: 550sqm (established areas), 440sqm (new developments)
Key Growth Pockets:
- Melton South: Experiencing rapid development with multiple new estates
- Melton West: Family-oriented area with established amenities
- Toolern Precinct: Major planned development zone with significant infrastructure investment
- Cobblebank: Emerging suburb with new railway station and planned town center
Demographic & Community Deep-Dive
Population Statistics:
- Current Population: Approximately 72,800 residents
- Projected Growth Rate: 4.3% annually through 2030
- Population Density: 720 persons per square kilometer
- Median Age: 34 years (compared to Melbourne average of 37)
Household Composition:
- Couples with Children: 38.2%
- Couples without Children: 24.6%
- Single Parent Families: 14.1%
- Single Person Households: 20.7%
- Other Household Types: 2.4%
- Average Household Size: 2.9 persons
Socioeconomic Indicators:
- Median Weekly Household Income: $1,460
- Unemployment Rate: 6.8% (above Melbourne average)
- Home Ownership: 68% (32% fully owned, 36% mortgaged)
- Rental Households: 29%
- Other Tenure Types: 3%
Cultural & Linguistic Diversity:
- Born in Australia: 68.4%
- Top Overseas Birth Countries: India (5.9%), Philippines (3.2%), United Kingdom (2.8%), New Zealand (2.1%), Vietnam (1.7%)
- Languages Other Than English Spoken at Home: 28.3%
- Faith Communities: Christian denominations (52%), Islam (4.8%), Hinduism (4.2%), Buddhism (2.1%), No Religion (32.6%)
Community Engagement:
- Active Community Groups: 65+ registered associations
- Sports Club Membership: 27% of residents participate
- Volunteer Rate: 18.6% of residents regularly volunteer
- Community Satisfaction Rating: 6.8/10 (Council survey, 2024)
Infrastructure & Amenities Comprehensive Overview
Education Facilities:
- Primary Schools: 12 (8 public, 4 private/religious)
- Secondary Schools: 5 (3 public, 2 private/religious)
- P-12 Colleges: 2
- Tertiary Education:
- Victoria University Melton Campus (offering selected undergraduate courses)
- Melton TAFE (Certificate I-IV courses and diplomas)
- Adult Education Center (community education programs)
- Educational Performance Metrics:
- VCE Median Study Score: 28 (state average: 30)
- Student Retention Rate to Year 12: 73%
- Post-School University Participation: 29%
Healthcare Services:
- Primary Healthcare:
- 18 General Practice Clinics
- 9 Dental Practices
- 12 Allied Health Centers
- Secondary Healthcare:
- Melton Health (outpatient services)
- Melton SuperClinic (diagnostic services)
- Djerriwarrh Health Services
- Emergency Services:
- 25-minute drive to Western Hospital Footscray
- 20-minute drive to Sunshine Hospital
- Aged Care Facilities: 4 residential facilities with combined 280+ beds
Retail & Commercial Infrastructure:
- Major Shopping Centers:
- Woodgrove Shopping Centre (85,000sqm, 160+ retailers)
- Melton Central Shopping Centre (12,000sqm, 45 retailers)
- Retail Strips:
- High Street Precinct (traditional main street)
- Coburns Road Shopping Strip
- Supermarkets: 6 major chains plus independent grocers
- Hospitality Venues: 68 cafes/restaurants, 12 pubs/bars
- Commercial Zones: 4 designated business parks
- Employment Hubs: Western Business Accelerator and Centre for Excellence
Recreation & Leisure:
- Parks & Reserves: 42 public parks covering 580 hectares
- Major Recreational Assets:
- Melton Recreation Reserve
- Melton Botanic Garden (26 hectares)
- Hannah Watts Park
- Melton Reservoir
- Sporting Facilities:
- 3 aquatic/leisure centers
- 8 sporting reserves with multiple playing fields
- 6 tennis complexes
- 4 lawn bowling clubs
- Tabcorp Park (premier harness racing facility)
- Cultural Facilities:
- Melton Library and Learning Hub
- Melton Community Hall
- CS Gallery (contemporary art space)
- Youth performance space
Development Trajectory & Future Planning
Strategic Importance:
- Designated as a Major Activity Centre in Plan Melbourne 2017-2050
- Key component in Victoria’s Western Growth Corridor Plan
- Priority Development Zone status for accelerated approvals
Current Development Activity:
- 9 active major residential estates under construction
- 2,200+ residential lots in active development pipeline
- Commercial development value: $340+ million (current projects)
- Residential development value: $1.2+ billion (current projects)
Major Infrastructure Projects:
- Transport:
- Western Rail Plan implementation (2025-2032)
- Western Freeway expansion (additional lanes)
- Melton Highway duplication project
- Community:
- Toolern Regional Park development
- Western BACE expansion
- New aquatic center (construction commencing 2026)
- Commercial:
- Cobblebank Metropolitan Activity Centre
- Toolern Employment Precinct
Planning Framework:
- Melton Planning Scheme Amendment C201 (facilitating employment precinct)
- Precinct Structure Plans approved for 15 growth areas
- Urban Growth Boundary expansion allowances
Community & Lifestyle Characteristics
Resident Profile:
- Predominantly young families (36% of households have children under 15)
- First home buyers (representing 32% of property purchases)
- Commuter professionals (42% travel outside the area for work)
- Multi-generational households (11% higher than Melbourne average)
Lifestyle Patterns:
- Community-oriented with high participation in local events
- Strong sporting culture across all age demographics
- Growing café/dining scene particularly in established areas
- Family-focused recreational activities
Community Challenges:
- Service access inequalities between established and new growth areas
- Public transport limitations in newer estates
- Youth engagement and employment opportunities
- Managing integration between established and new communities
Social Cohesion Indicators:
- Community participation rate in local events: 32%
- Neighborhood connection score: 6.4/10 (Council survey)
- New resident integration programs: 8 active initiatives
- Cross-cultural community events: 12 annual major events
School Catchment & Education Landscape
Public School Zoning:
- Primary School Zones: 8 distinct catchments with varying enrollment pressures
- Secondary School Zones: 3 main catchments with Melton Secondary College experiencing highest demand
Educational Demographics:
- School-aged population: 22.6% of residents
- Student-to-teacher ratio: 23:1 (public primary), 19:1 (public secondary)
- Special needs education provision: 4 specialized programs
Educational Development:
- Planned new P-9 college in Cobblebank (opening 2027)
- Catholic secondary college expansion (additional 400 places by 2026)
- Early learning center construction program (5 new centers by 2028)
Conclusion & Future Outlook
Melton represents one of Melbourne’s most significant growth opportunities with a compelling value proposition for both homebuyers and investors. The suburb’s combination of affordability, strategic location within a designated growth corridor, and substantial infrastructure pipeline positions it well for sustained development over the coming decades.
The area’s transformation from a satellite town to an integrated component of metropolitan Melbourne continues to accelerate, with key catalysts including transport connectivity improvements, employment precinct development, and comprehensive planning frameworks supporting sustainable growth.
For prospective residents, Melton offers an accessible entry point to home ownership with a growing range of lifestyle amenities. For investors, the suburb presents multiple strategic opportunities across different investment approaches, supported by strong rental demand and long-term capital growth fundamentals.
The most significant determinant of Melton’s future success will be the effective coordination of infrastructure delivery with population growth, particularly in transport connectivity and community service provision. With appropriate implementation of existing planning frameworks, Melton is positioned to evolve into a thriving, well-connected component of Melbourne’s western region.